This section gives some overall numbers about the applications we received and the grants approved in the 12 months to 31 March 2025.
This year was the fourth full year of operation under the Foundation’s current grants strategy, launched in June 2018.
In the year to 31 March 2025:
We made 52 grants worth £5.09m
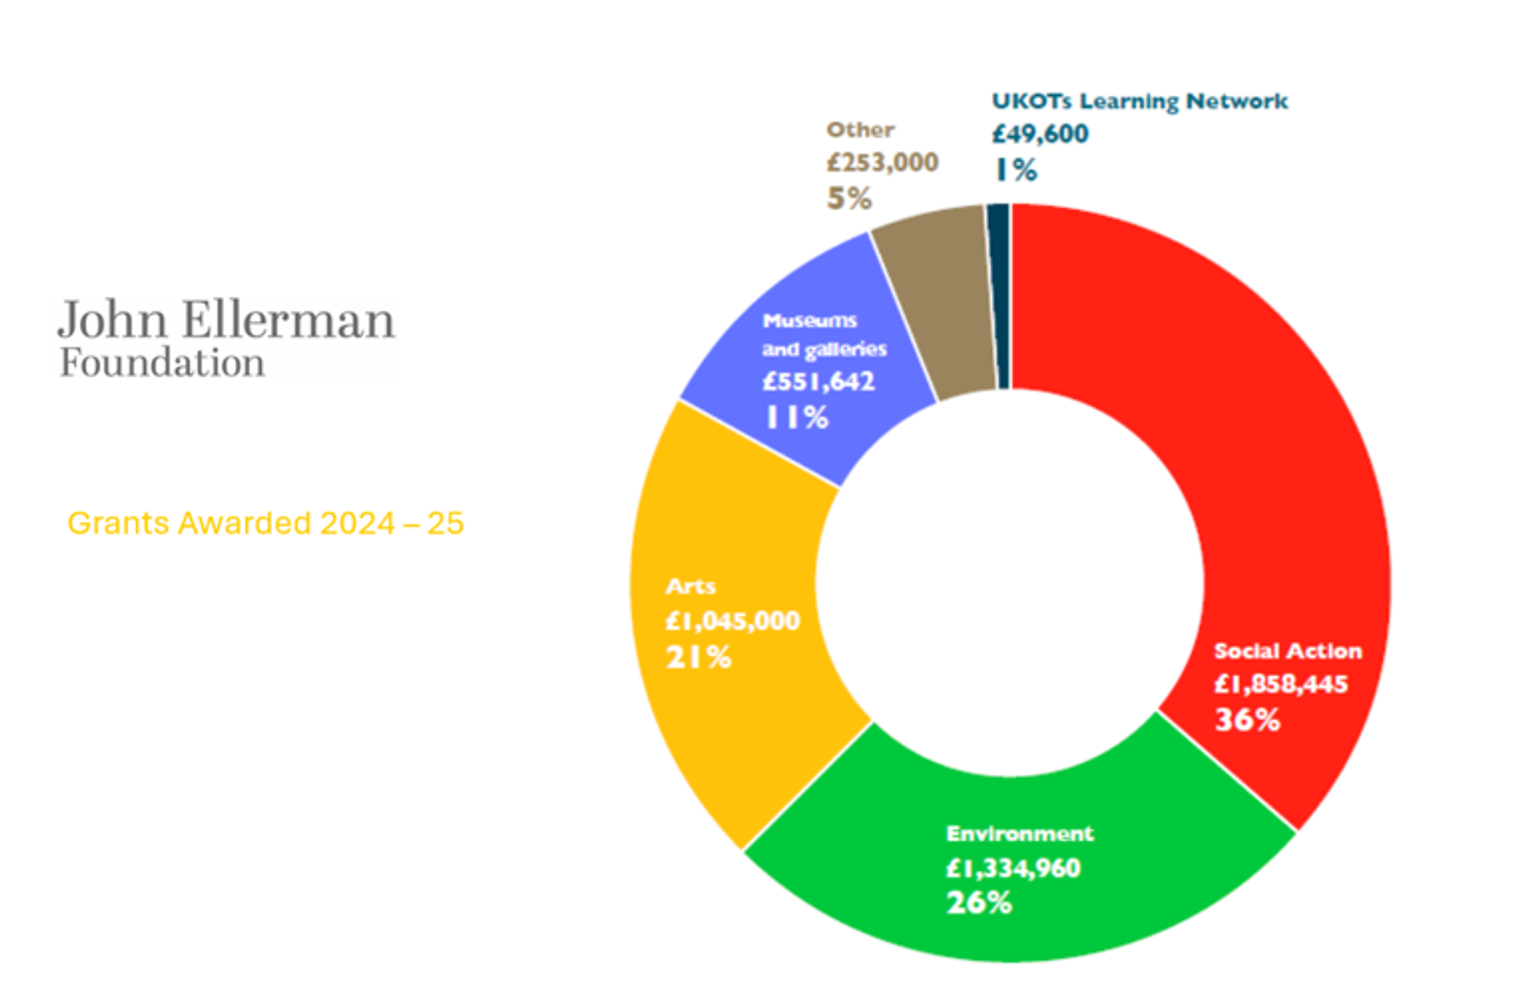
The expenditure per category was as follows:
Category |
Spend |
Arts |
21% |
Environment |
26% |
Social Action |
36% |
Museums and Galleries Fund |
11% |
Other |
5% |
UKOTs Learning Network |
1% |
Size and types of grant
The average overall size of grant on our Main Grants programme increased this year to £111,537, compared to £101,335.88 last year. The majority (77%) of our grants were for core costs, and most (71%) were for three years. However, the length and type of grant are flexible and are based on what applicants ask for.
Success rates
On our Main Grants programme, we had an overall success rate of 8% and on our Museums and Galleries programme we had a success rate of 8%.

Prior relationship with applicants
We are aware of the importance of creating long-term relationships with organisations. However, as an open and responsive grantmaker, we also need to keep space in our portfolio for organisations that are new to us. Overall, 48% of grants were awarded to previous grant-holders, 27% went to first time applicants, and 27% went to organisations that had previously applied unsuccessfully.
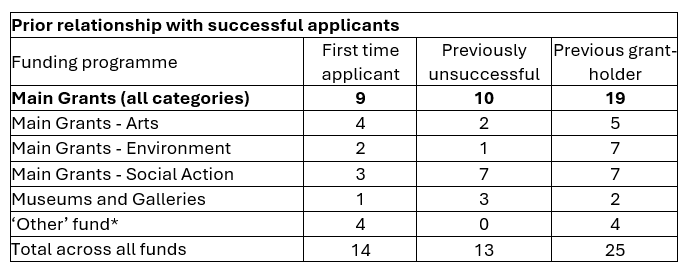
For more detail about our grantmaking statistics for 2024/25, including an overview of data pertaining to diversity, equity and inclusion, please read our most recent annual report and accounts here.
This section gives some overall numbers about the applications we received and the grants approved in the 12 months to 31 March 2024.
This year was the fourth full year of operation under the Foundation’s current grants strategy, launched in June 2018.
In the year to 31 March 2024:
We made 58 grants worth £5.21m
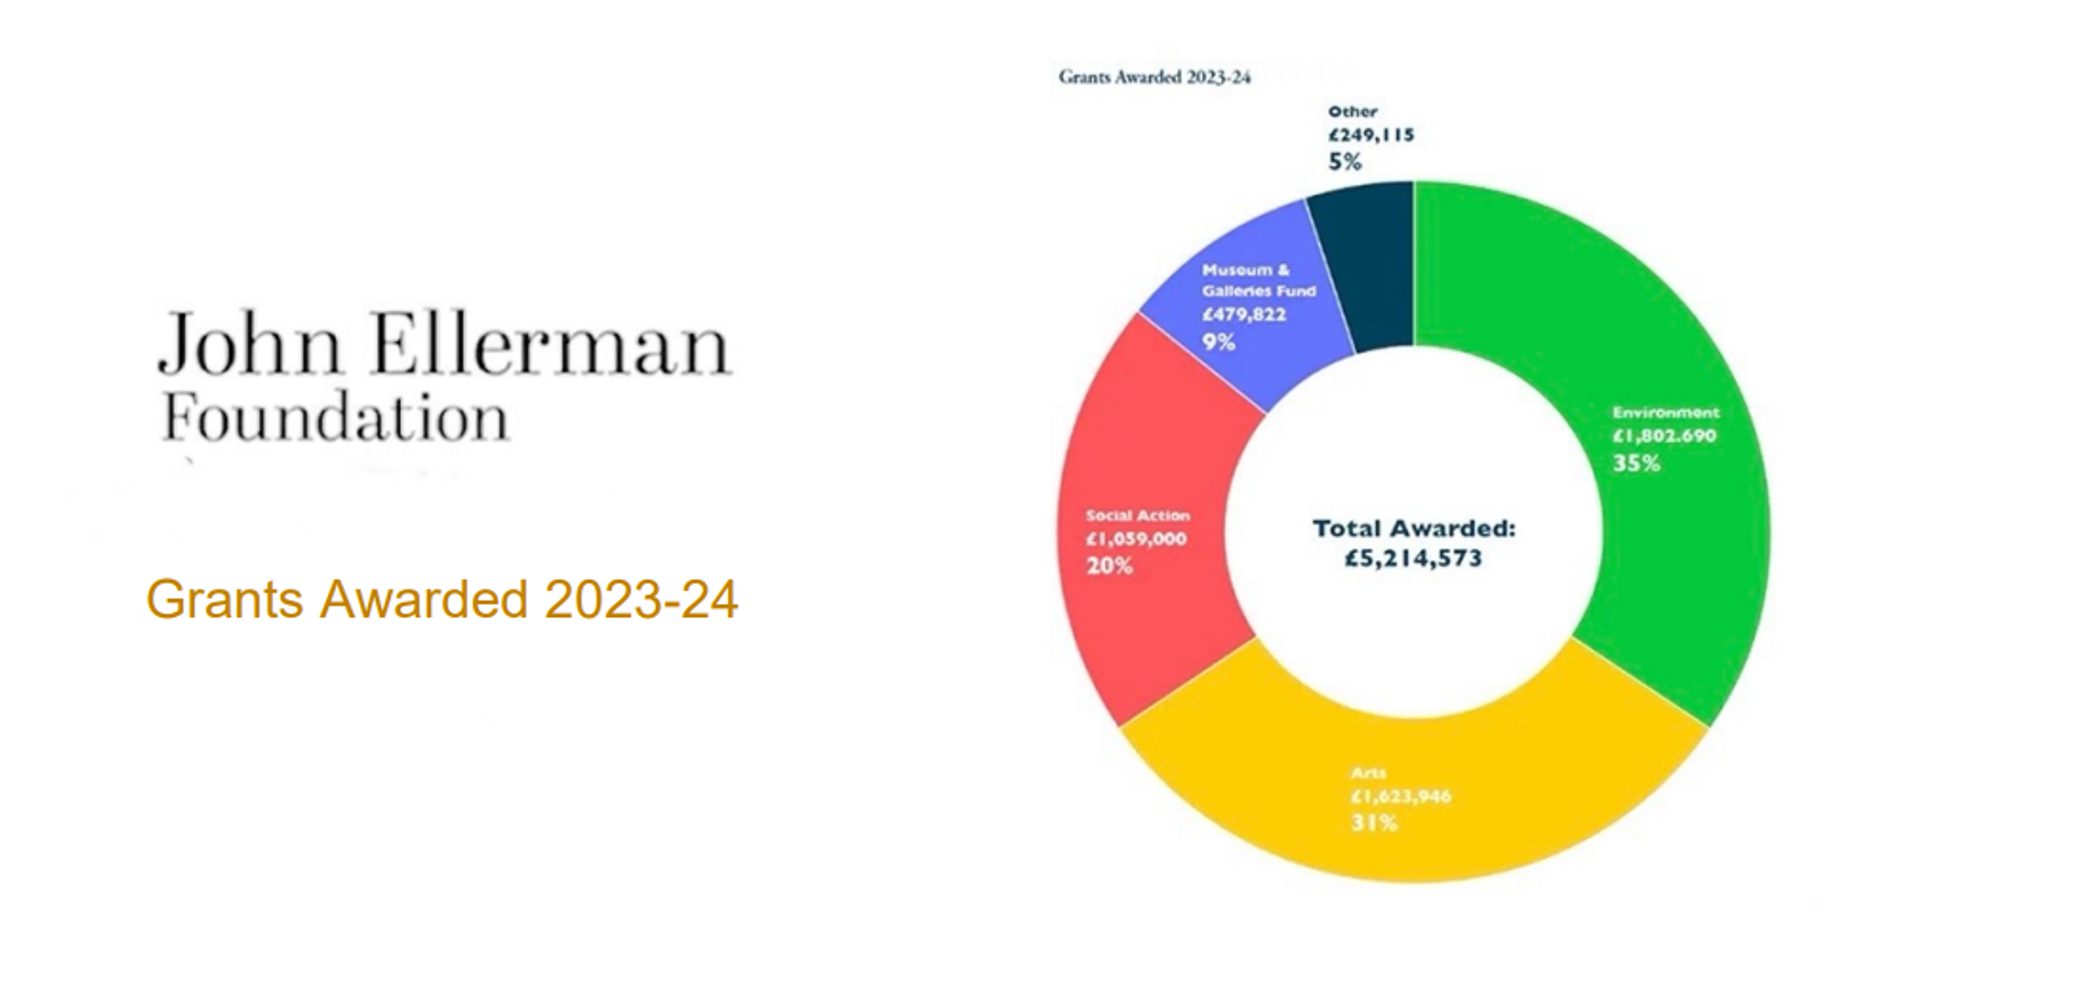
The expenditure per category is as follows:
Category |
Spend |
Arts (including Museums and Galleries Fund) |
31% |
Environment |
35% |
Social Action |
20% |
Museums and Galleries |
9% |
Other |
5% |
The average overall size of grant increased this year to £101,335.88 (compared to £96,542 last year).
48 out of our 58 grants were for core funding.
Just over half of applications (256) were for our Social Action category. 123 (27%) applications were for our Arts category and there were 83 (18%) in Environment. Of these applications, 153 (33%) did not meet our criteria, resulting in 309 (67%) applications being presented for review by our Trustees.
Of the 309 (compared to 263 last year) eligible first-stage applications assessed under our Main Grants programme (i.e. excluding Museums and Galleries Fund and our ‘Other’ category), 45 applications were presented for decision at a Trustee Board meeting, and 43 resulted in a grant. This represents a success rate of 96% at second stage, and reflects our goal of bringing though second stage applications that stand the highest chance of success. However, from the initial application to final decision, there is an overall success rate of 14%, significantly down from last year’s rate of 28% and the range observed since we launched our current funding guidelines in 2018. The success rate also varied by category, in part due to the variation in application numbers across the three themes. Environment had a success rate of 20%, followed by Arts at 14% and Social Action at 4%.
This year 38 of our grants (66%) were for three years, 12 were for two years (21%) and five were for one year (9%). Of the 58 grants awarded in total this year under all funding categories and funding streams, 29 (50%) were awarded to previous grant-holders that have held grants with us in the past, 11 (19%) went to first-time applicants and 18 (31%) were made to organisations who had applied to us unsuccessfully on previous occasions. This even split between new and previous grant-holders is different to last year, where more grant-holders were new to us, but more aligned with our usual trend from previous years.
This section gives some overall numbers about the applications we received and the grants approved in the 12 months to 31 March 2023.
This year was the fourth full year of operation under the Foundation’s current grants strategy, launched in June 2018.
In the year to 31 March 2023:
We made 74 grants worth £6.27m
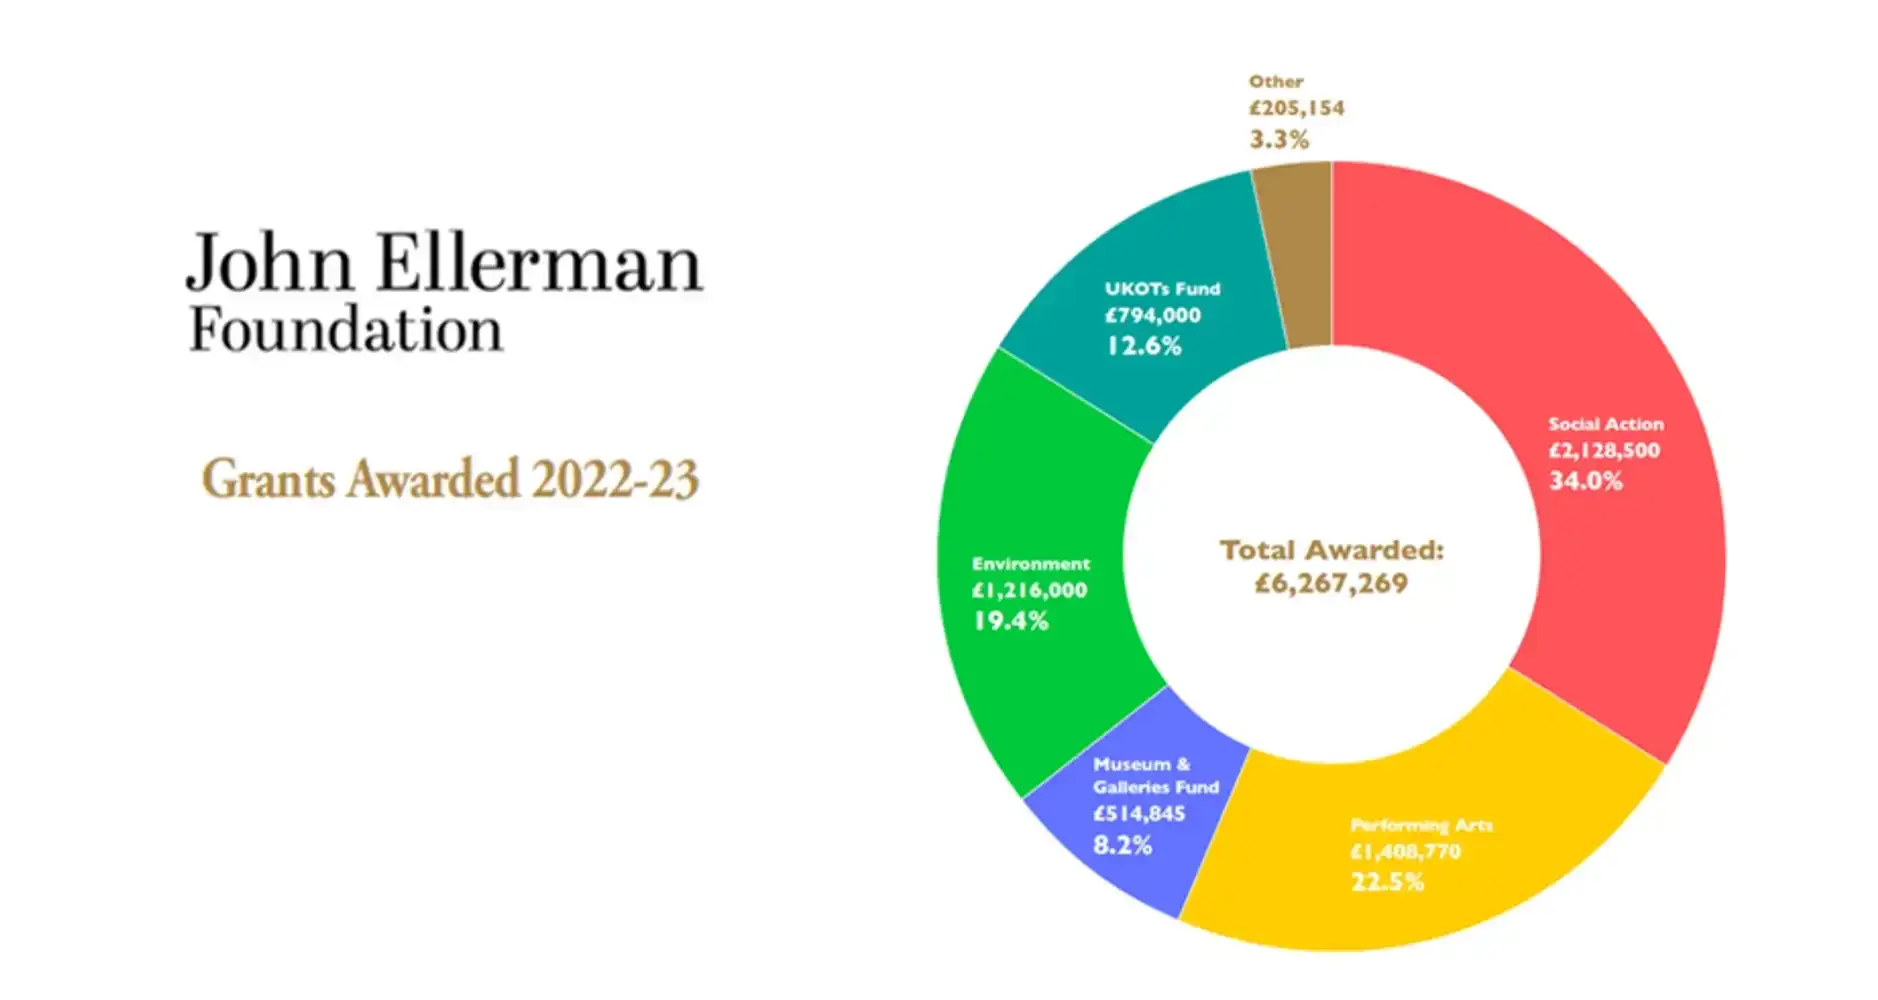
The expenditure per category is as follows:
Category |
Spend |
Arts (including Museums and Galleries Fund) |
30.7% |
Environment |
19.4% |
Social Action |
34% |
UKOTs |
12.6% |
Other |
3.3% |
65 out of the 74 grants were for core funding
The average overall size of grant decreased this year to £96,542 compared to £108,856 last year.
This year more than half of our grants were for three years (43 out of 74).
We received 357 first-stage applications this year under our three main categories, which represents a 20% increase from last year. Following the trend of previous years, the majority of applications (61%) came in under Social Action, followed by Performing Arts (23%) and Environment (17%). Of these applications, 89 did not meet our criteria and five decided to withdraw, resulting in 263 applications (74%) being presented for review by our Trustees.
Of the 263 (compared to 199 last year) eligible first-stage applications assessed under our Main Grants programme (i.e. excluding Museums and Galleries Fund, our ‘Other’ category and the UK Overseas Territories Fund), 74 resulted in a grant. This represents a success rate of 28%, slightly down from last year’s rate of 30%, but within the range observed since we launched our current funding guidelines in 2018.
Of the 61 applications presented for decision at a Trustee Board meeting under our Main Grants Programme this year, 13 were declined. This represents a success rate of 79% at second stage, which is lower than last two years’ success rates of 91% (2020-21) and 88% (2021-22).
This year saw success rates vary across the different funding streams, in a similar manner to last year. Social Action saw eight out of 28, or 29%, second stage applications declined, whereas Environment and Arts were at similar levels (with three out of 16, or 19%, and two out of 17, or 12%, declined respectively).
Of the 74 grants awarded in total this year under all funding categories and funding streams, 51 (69%) went to first-time applicants and 19 (26%) were awarded to previous grant-holders. The remaining four grants (5%) were made to organisations who had applied to us unsuccessfully on previous occasions. This is a change from last year, where our grants were awarded fairly equally between new organisations and those already known to us.
This section gives some overall numbers about the applications we received and the grants approved in the 12 months to 31 March 2022.
This year was the third full year of operation under the Foundation’s current grants strategy, launched in June 2018.
In the year to 31 March 2022:
We made 72 grants worth £6.64m
The expenditure per category is as follows:
Category | Spend |
Arts (including Museums and Galleries Fund) | 30% |
Environment | 25% |
Social Action | 26% |
UKOTs / Other | 24% |
55 out of the 72 grants were for core funding.
The average grant size was for £108,056 overall compared to £100,727 last year.
This year more than half of our grants were for three years (38 out 72).
We received 298 first-stage applications this year. Over half of these came in under Social Action (59%) followed by Performing Arts (25%) and Environment (16%). Out of the 298 applications received under our main categories, 94 did not meet our criteria and five decided to withdraw, resulting in 199 applications (67%) being presented for review by our Trustees.
Of the 199 (compared to 188 last year) eligible firststage applications assessed under our three main categories (i.e. excluding Museums and Galleries Fund, our ‘other’ category and UKOTs Fund), 61 resulted in a grant. This represents a success rate of 31%, which is within the range observed since we launched our current grants strategy in 2018.
Of the 69 applications presented for decision at a Trustee Board meeting this year under our Main Grants Programme, eight were declined. This represents a success rate of 88% at second stage, which is slightly lower than last year’s success rate of 91%, but exactly the same as the year before that.
This year the success rate varied less significantly across the different funding streams; six second stage applications under Social Action were declined, whereas Environment and Arts saw one application being declined.
Of the 72 grants awarded this year under all funding categories and funding streams, 28 (39%) went to first-time applicants and 38 (53%) were awarded to previous grant-holders. The remaining six grants (8%) were made to organisations who had applied to us unsuccessfully on previous occasions.
This section gives some overall numbers about the applications we received and the grants approved in the 12 months to 31 March 2021.
This year was the second full year of operation under the Foundation’s current grants strategy, launched in June 2018.
In the year to 31 March 2021:
We made 64 grants worth £5.7m
The expenditure per category is as follows:
Category |
Spend |
Arts (including Museums and Galleries Fund) |
32% |
Environment |
28% |
Social Action |
32% |
Other |
8% |
53 out of the 64 grants were for core funding.
The average grant size was for £100,727 overall compared to £99,942 last year.
The majority of our grants were for three years (33 out 64).
This year we received 168 eligible general applications under our three main categories (i.e. excluding Museums and Galleries Fund) and 70 were invited to submit a second stage application. This represents a success rate of 42%, significantly higher than last year (30%).
Of the 70 applications presented for decision at a Board meeting this year, six were declined. This represents a success rate of 91% at second stage, which is slightly higher than last year’s success rate of 88%. This year the success rate varied less significantly across the different funding streams; three second stage applications under Social Action were declined, whereas Environment and Arts saw one and two applications being declined respectively.
Of the 64 grants awarded this year, about a third (21) went to first-time applicants and half (32) to previous grantees. The remaining 11 grants were made to organisations who had applied to us unsuccessfully on previous occasions.
This section gives some overall numbers about the applications we received and the grants approved in the 12 months to 31 March 2020.
This year was the first full year of operation under our current grants strategy which was launched in June 2018. There was a small increase in the number of applications received compared to the previous year.
In the year to 31 March 2020:
We made 57 grants worth £5.61m
The expenditure per category is as follows:
Category |
Spend |
Arts (including Museums and Galleries Fund) |
36% |
Environment |
26% |
Welfare (previous strategy) |
34% |
Social Action (new strategy) |
34% |
Other |
4% |
50 out of the 57 grants were for core funding.
The average grant size was for £38,866 per annum or £99,942 overall.
The majority of our grants were for three years (38 out 57).
We received 272 applications, including 69 Museums and Galleries Fund applications. Out of the 186 eligible general applications (not including the Museums and Galleries Fund), 55 were invited to submit a second stage application, which represents a 30% success rate. Of the 65 second stage applications brought to the Board 57 received a grant, which represents an 88% success rate.
In a majority of cases the reason for turning down applications was related to the fact that they did not provide a sufficiently strong fit with the individual criteria of the relevant funding category. Lack of national significance continues to be a factor but significantly less so than under the previous grants strategy, when it was consistently the main reason for rejecting applications.
This section gives some overall numbers about the applications we received and the grants approved in the 12 months to 31 March 2019.
This was an unusual year, as we were closed to new applications for the first three months during our strategic review. Grants approved in the first half of this year were part of our previous grants strategy, whereas grants made from November 2018 onwards were awarded in line with the new criteria.
In the year to 31 March 2019:
We made 55 grants worth £5.13m
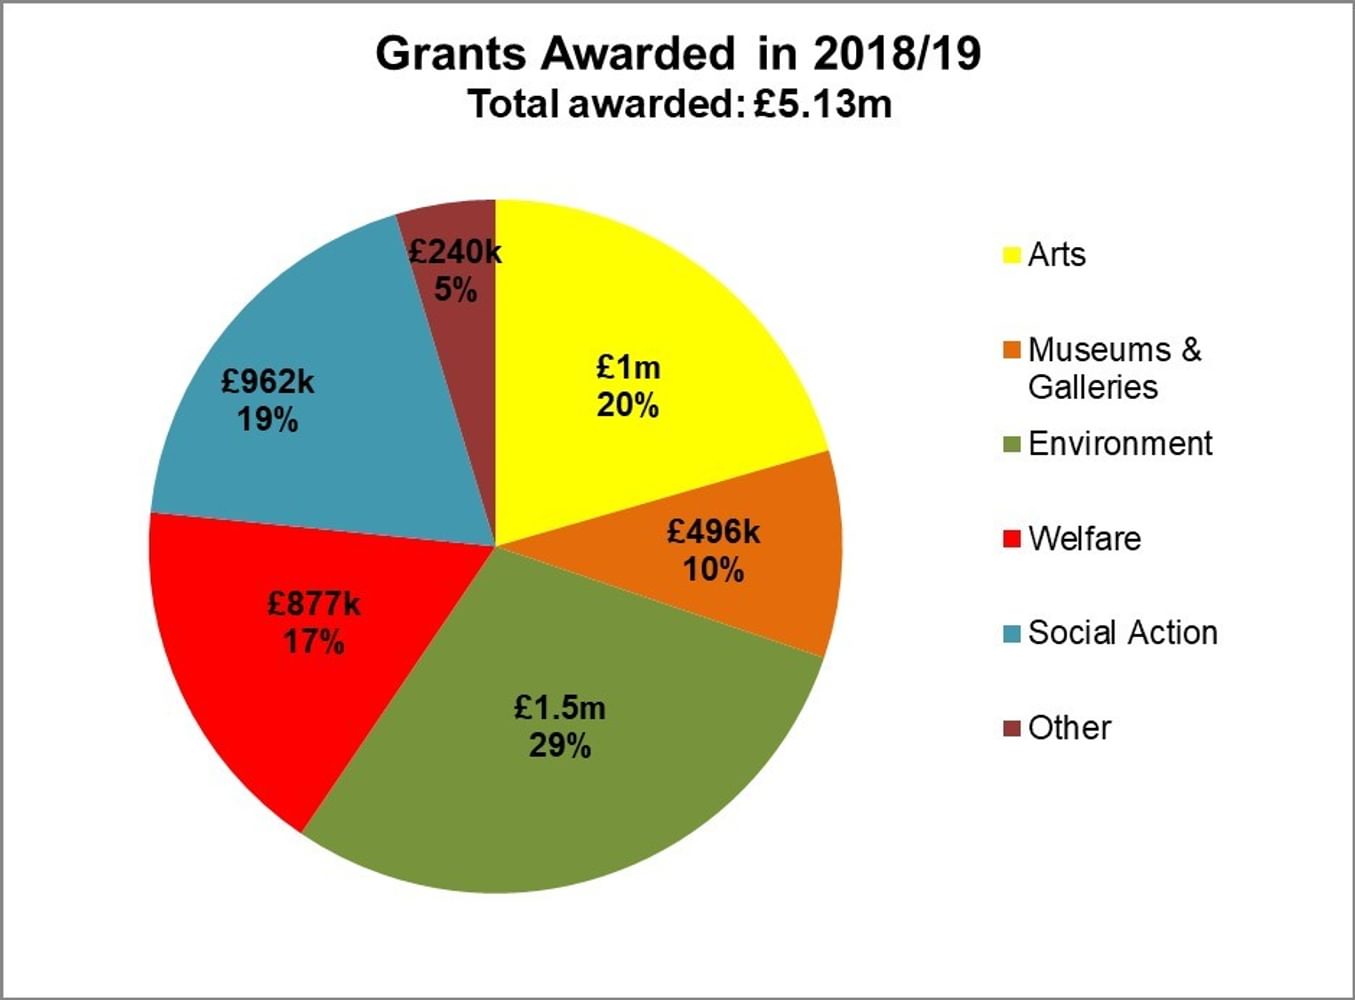
This section gives some overall numbers about the applications we received and the grants approved in the 12 months to 31 March 2018.
This was an unusual year, as we were closed to new applications for three months during our strategic review. Although closed for this period the number of applications remained similar to previous years.
In the year to 31 March 2018:
We made 67 grants worth £5.55m
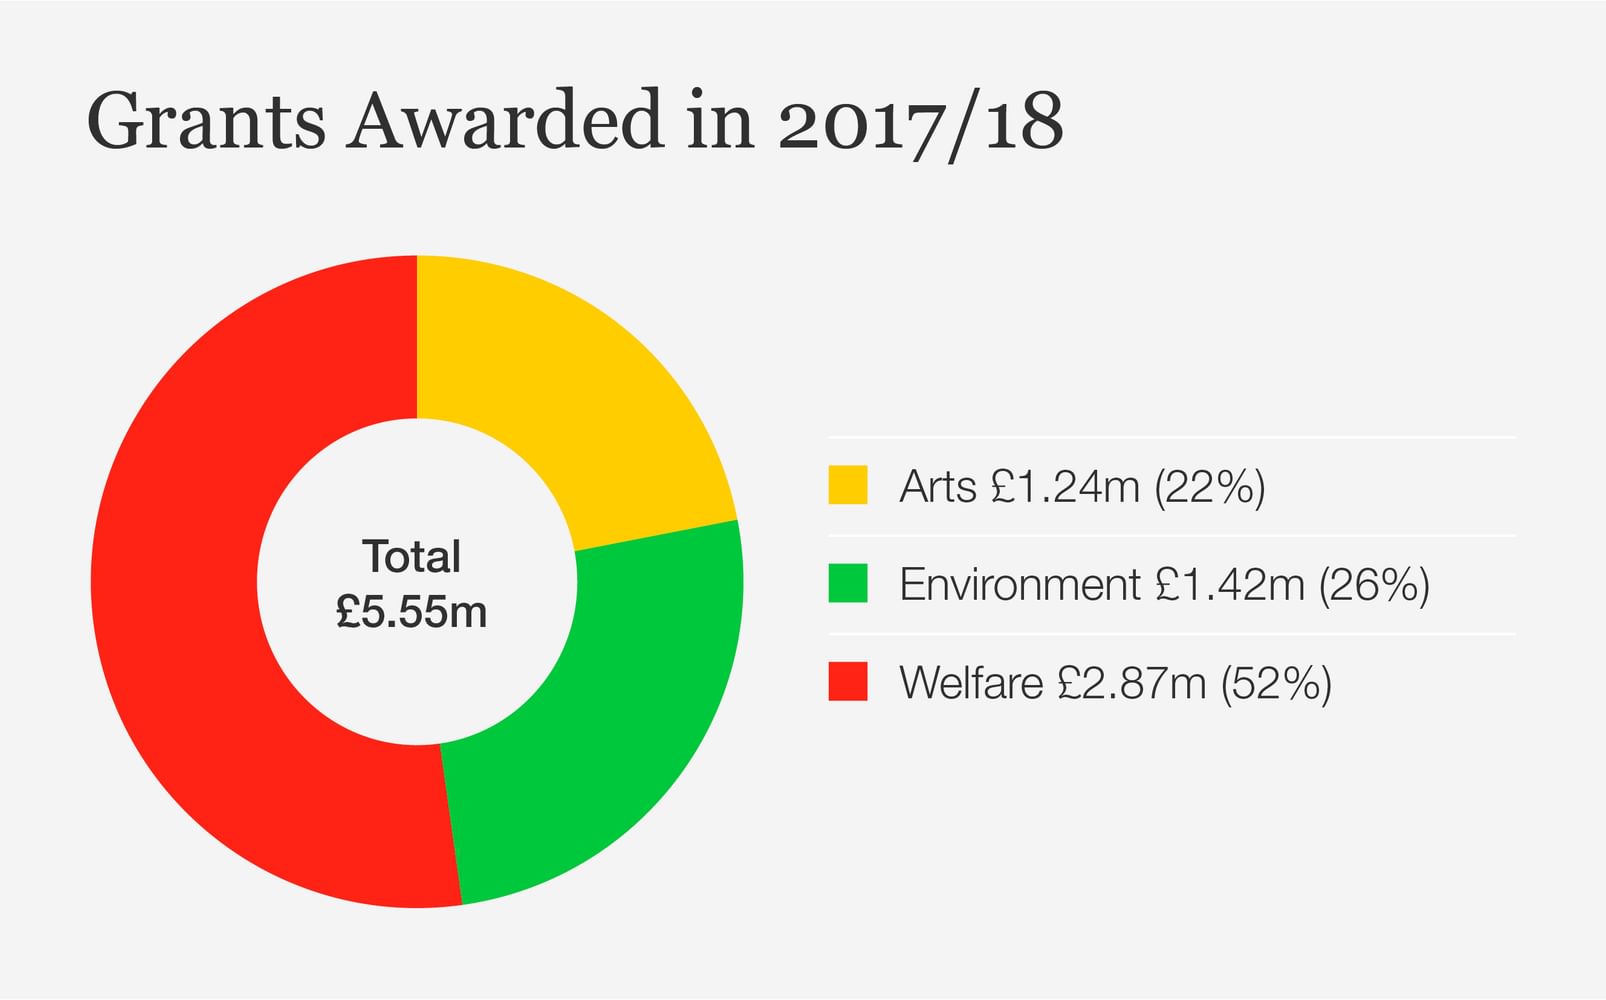
The budget and expenditure are as follows:
Category | Allocation | Spend |
Arts (including Museums and Galleries Fund) | 25% | 22% |
Environment | 25% | 26% |
Welfare | 50% | 52% |
60 out of the 67 grants were for core funding.
The average size of a grant was for £31,700 per annum or £82,770 overall.
The majority of our grants were for multiple years with 22 for two years and 48 for three years.
We received 486 applications, including 89 Museums and Galleries Fund applications. Out of the 248 eligible general applications, 72 were invited to submit a second stage application, which represents a 29% success rate. Of the 72 second stage applications brought to the Board 67 received a grant, which represents a 93% success rate.
The absence of national significance continues to be the principal reason for applications being turned down at the first stage, with 77 out of the 150 ineligible applications (51%) failing on this count.

